
Page 85 - KDU Law Journal Volume 4 Issue 2
P. 85
KDU Law Journal Volume 04 Issue II
September, 2024
Limb (B ) -Part-I- Vanni District-
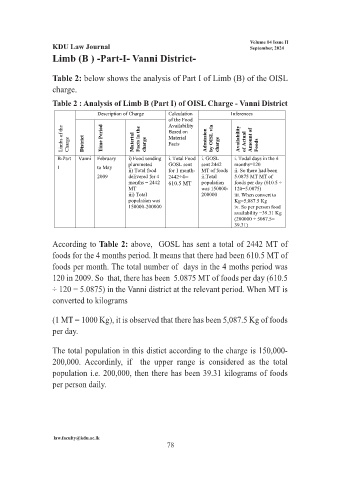
Table 2: below shows the analysis of Part I of Limb (B) of the OISL
charge.
Table 2 : Analysis of Limb B (Part I) of OISL Charge - Vanni District
Description of Charge Calculation Inferences
of the Food
Availability
Limbs of the Charge District Time Period Material Facts in the charge Based on Admission by OISL via charge Availability of Actual Amount of Foods
Material
Facts
B-Part Vanni February i) Food sending i. Total Food i. GOSL i. Todal days in the 4
I to May plummeted GOSL sent sent 2442 months=120
ii. So there had been
ii) Total food
for 1 month- MT of foods
2009 delivered for 4 2442÷4= ii.Total 5.0875 MT MT of
months = 2442 610.5 MT population foods per day (610.5 ÷
MT was 150000- 120=5.0875)
iii) Total 200000 iii. When convert to
population was Kg=5,087.5 Kg
150000-200000 iv. So per person food
availability =39.31 Kg
(200000 ÷ 5087.5=
39.31)
According to Table 2: above, GOSL has sent a total of 2442 MT of
foods for the 4 months period. It means that there had been 610.5 MT of
foods per month. The total number of days in the 4 moths period was
120 in 2009. So that, there has been 5.0875 MT of foods per day (610.5
÷ 120 = 5.0875) in the Vanni district at the relevant period. When MT is
converted to kilograms
(1 MT = 1000 Kg), it is observed that there has been 5,087.5 Kg of foods
per day.
The total population in this distict according to the charge is 150,000-
200,000. Accordinly, if the upper range is considered as the total
population i.e. 200,000, then there has been 39.31 kilograms of foods
per person daily.
law.faculty@kdu.ac.lk
78